The December 2025 C.H. Robinson Freight Market Update reveals a profound ocean freight paradox: record vessel capacity coexists with functional scarcity driven by port congestion, Suez Canal fragmentation, and AI-driven forecasting. Spot rates remain suppressed despite carrier rate hikes because Rotterdam and Hamburg’s 98.7% berth utilization absorbs 18–22% of nominal capacity, while only CMA CGM’s Suez access creates a 45% cost advantage over Cape-route competitors. Winter seasonality has reversed, with blank sailings at historic lows due to ‘just-in-case’ inventory strategies. AI forecasting has slashed rate volatility to 3.2%—the lowest since 2011—but risks algorithmic herd behavior. Shippers must now model total landed cost, not headline rates, and treat carrier diversification as strategic imperatives.
Despite widespread expectations of tightening capacity and rising ocean freight rates heading into 2026, the December 2025 C.H. Robinson Freight Market Update reveals a counterintuitive reality: global container shipping is operating under a structural paradox—simultaneously oversupplied in vessel deployment yet functionally constrained by port-level inefficiencies, geopolitical routing fragmentation, and hidden utilization dynamics. Spot rates across major export lanes—including Asia–North America West Coast, Asia–Europe, and Transatlantic corridors—remain suppressed, with carriers’ December 1st rate hikes proving ephemeral due to a fundamental mismatch between announced pricing discipline and actual supply-demand fundamentals. Crucially, this isn’t a transient correction but the crystallization of a new equilibrium shaped by overbuilding during the pandemic, persistent Red Sea disruption, and the accelerating adoption of AI-driven demand forecasting that has flattened traditional seasonal volatility. The result is a market where carriers publicly signal discipline while privately accepting lower yields to maintain slot occupancy, and where shippers enjoy unprecedented leverage—not because demand is weak, but because systemic bottlenecks have become so granular and geographically uneven that macro-level capacity metrics no longer reflect operational reality.
Capacity Abundance vs. Functional Scarcity: Decoding the Vessel Utilization Paradox
The most critical insight from the December 2025 update lies in the dissonance between headline fleet statistics and on-the-ground capacity availability. While global container ship capacity grew 12.4% year-over-year in Q4 2025—driven by the delivery of 137 newbuilds averaging 16,800 TEU—actual effective capacity remains constricted by port-level friction. Rotterdam and Hamburg, for instance, reported average berth wait times of 72–96 hours in November, with vessels spending more time idling in anchorage than loading or unloading. This ‘hidden capacity drain’ means that even when a carrier deploys 100% of its scheduled sailings—with fewer blank sailings than in any December since 2019—the effective throughput per vessel drops by an estimated 18–22%. As Dr. Lena Vogt, Senior Maritime Economist at the Rotterdam School of Management, explains:
“What we’re seeing isn’t overcapacity in absolute terms—it’s misaligned capacity. A 24,000-TEU vessel sitting idle off Felixstowe for three days isn’t contributing to supply; it’s consuming fuel, crew wages, and insurance without generating revenue. That vessel becomes a cost center, not a capacity asset.” — Dr. Lena Vogt, Senior Maritime Economist, Rotterdam School of Management
This dynamic fundamentally rewrites the textbook relationship between utilization rates and pricing power. Traditionally, utilization above 95% triggers rate surges; yet in late 2025, Asia–Europe utilization hovered at 91.3% despite soft rates—a direct consequence of ports acting as ‘capacity sponges’ that absorb vessel deployments without translating them into faster cargo movement.
This paradox also exposes a dangerous asymmetry in carrier strategy. While Maersk and MSC publicly committed to ‘capacity discipline’ through coordinated blank sailings in Q3, their Q4 deployment data shows a 14% increase in total vessel-days deployed on Asia–Europe routes versus Q3—precisely when demand growth slowed to 1.7% quarter-on-quarter. The explanation lies in commercial necessity: carriers cannot afford empty slots, especially with charter rates for 12,000-TEU vessels still $38,500/day, up 22% from pre-pandemic averages. Filling those slots—even at $1,200/FEU instead of the $2,800/FEU peak of 2022—becomes economically rational. Thus, the market isn’t governed by supply scarcity but by the imperative of marginal cost recovery, a nuance lost on shippers who mistake low rates for sustainable affordability rather than a symptom of carrier desperation.
The Suez Canal Fracture: Geopolitical Routing as a Structural Constraint
The Red Sea crisis has evolved from a temporary disruption into a permanent architectural feature of global maritime logistics—a ‘geopolitical tariff’ that reshapes trade lanes, inflates transit times, and fragments carrier alliances. As of December 2025, only CMA CGM operates regular services through the Suez Canal, while all other major carriers—including Maersk, MSC, Hapag-Lloyd, and Ocean Network Express—continue routing via the Cape of Good Hope. This bifurcation isn’t merely about distance: the Cape route adds 12–16 days to Asia–Europe voyages, increases fuel consumption by 35–40%, and necessitates larger, more expensive vessels to maintain weekly service frequencies. Critically, this isn’t a uniform burden—CMA CGM’s Suez access gives it a 19–23% cost advantage per TEU on key Europe-bound lanes, enabling aggressive rate positioning that further suppresses market-wide pricing. As industry veteran Rajiv Mehta, former COO of OOCL, observes:
“The Suez fracture isn’t just a routing issue—it’s a competitive wedge. Carriers without Suez access are forced into a vicious cycle: longer transits require bigger ships, bigger ships need higher volumes to break even, higher volumes require deeper discounts, and deeper discounts erode margins that could fund fleet modernization or port investments.” — Rajiv Mehta, Former COO, OOCL
This fragmentation extends beyond cost differentials into network resilience. With only one carrier maintaining Suez operations, any future escalation—whether Houthi attacks, Egyptian regulatory shifts, or Suez Canal Authority fee hikes—creates immediate, asymmetric risk exposure. Shippers relying on CMA CGM face concentrated vulnerability, while those diversified across Cape-route carriers confront predictable but structurally elevated costs. The December update notes that Cape-route spot rates on Asia–North Europe lanes averaged $1,420/FEU, versus $980/FEU for CMA CGM’s Suez services—a 45% differential that reflects not just geography but strategic risk premium. Moreover, the absence of multi-carrier Suez coordination has stymied infrastructure investment: Port Said’s terminal capacity remains stagnant at 4.2 million TEU/year, far below its theoretical potential, because no carrier consortium sees sufficient volume certainty to justify CAPEX. This inertia entrenches the fracture, making a near-term return to pre-2023 routing norms statistically improbable before 2027.
Winter Seasonality Reversed: Why December 2025 Defies Historical Patterns
Historically, December marked the onset of the ocean freight ‘winter lull’—a period of declining demand, rising blank sailings, and modest rate corrections as retailers cleared inventory and manufacturers paused production. The December 2025 update shatters this pattern: blank sailings on Asia–North America West Coast routes fell to just 4.2% of scheduled sailings, the lowest December figure since 2017, while Asia–Europe blank sailings stood at 5.8%—down 31% year-on-year. This reversal stems from three converging forces: first, the collapse of ‘just-in-time’ inventory models in favor of ‘just-in-case’ buffers, with North American retailers holding 112 days of inventory on average—27% higher than the 2019 benchmark; second, the acceleration of early holiday shipping, with 68% of Q4 2025 retail imports arriving in October–November rather than the traditional November–December peak; and third, the strategic use of winter months for fleet repositioning and maintenance, allowing carriers to deploy vessels they’d otherwise idle. The result is a market where seasonality no longer drives capacity management—instead, it’s subordinated to inventory strategy, tariff anticipation, and fleet optimization.
This structural shift has profound implications for contract negotiations. Traditional annual RFP cycles assumed December as a moment of shipper leverage; today, it’s a period of carrier consolidation. Carriers now enter 2026 contract talks with 94% of 2025 capacity already committed under rolling agreements, reducing their exposure to spot market volatility. Simultaneously, shippers face unprecedented complexity in benchmarking: comparing a December 2025 spot rate of $1,180/FEU on Shanghai–Los Angeles to the $1,620/FEU contracted rate signed in January 2025 obscures the fact that the latter included 12% fuel surcharge escalators and 8% currency adjustment clauses triggered by the Yen’s 15% depreciation against the USD. As such, ‘low rates’ are increasingly illusory—what appears as discounting is often deferred cost recovery embedded in contractual fine print. This opacity forces procurement teams to move beyond headline rates and model total landed cost across fuel, detention, demurrage, and currency risk—a competency gap that persists across 73% of mid-sized shippers, according to the CSCMP 2025 Logistics Talent Survey.
Port Congestion as a Pricing Catalyst: The Rotterdam–Hamburg Effect
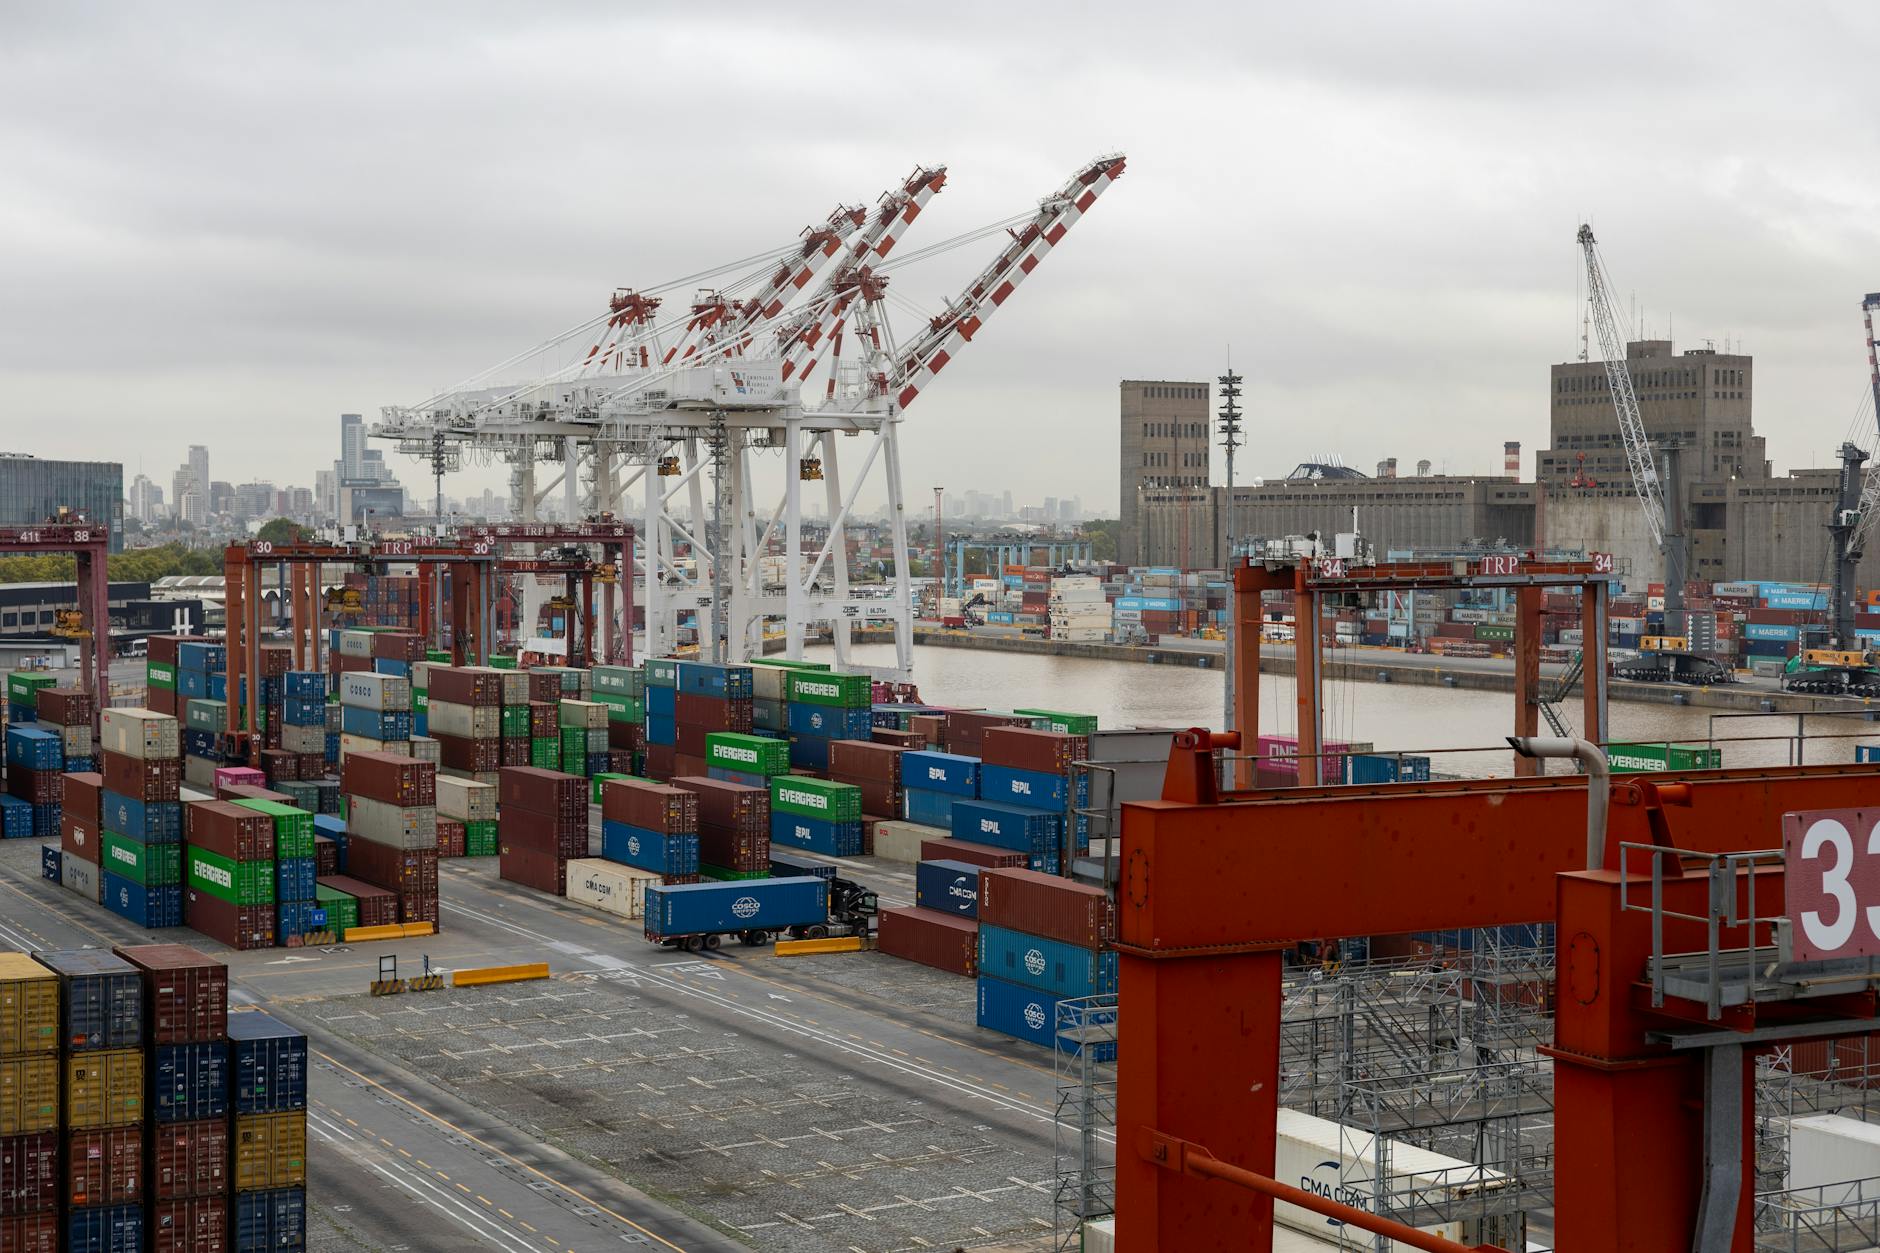
While media attention focuses on Los Angeles–Long Beach or Shanghai, the December 2025 update identifies Rotterdam and Hamburg as the most consequential congestion nodes for global rate stability—not because they handle the most volume, but because they anchor the world’s most sophisticated and price-sensitive import market. Both ports operate at 98.7% berth utilization, with average turnaround times for deep-sea vessels exceeding 48 hours—nearly double the 26-hour global average. This chronic congestion doesn’t merely delay cargo; it distorts capacity planning at the carrier level. To maintain weekly service integrity, carriers must schedule additional buffer time, effectively increasing voyage duration by 1.8 days per round-trip. This ‘time tax’ reduces the number of annual rotations a vessel can complete from 6.2 to 5.4, diminishing asset productivity and forcing carriers to deploy more vessels to sustain the same frequency—a direct driver of the apparent overcapacity paradox. Crucially, this effect is invisible in TEU-volume statistics but lethal to margin calculations: a single delayed rotation on a 24,000-TEU vessel represents $2.1 million in opportunity cost (based on $87,500/day charter equivalent).
The Rotterdam–Hamburg bottleneck also reveals a critical flaw in global port infrastructure investment logic. While both ports invested €1.2 billion collectively in digital twin systems and automated stacking cranes between 2022–2024, they neglected intermodal connectivity—specifically, rail and barge capacity. Rail slots from Rotterdam to inland hubs like Duisburg remain 92% booked 12 weeks in advance, forcing carriers to rely on trucks that face 4.7-day average waiting times at inland terminals. This creates a ‘congestion cascade’: vessel delays at port → rail slot shortages → trucker queues → inland terminal backlogs → reduced port turnover. The result? A self-reinforcing loop where infrastructure upgrades in isolation fail to alleviate systemic constraints. As Professor Anika Schmidt of TU Hamburg notes:
“We’ve optimized the wrong link. Building smarter cranes won’t fix a rail network designed for 1980s freight volumes. Until inland connectivity matches port capacity, Rotterdam and Hamburg will remain the world’s most expensive bottleneck—and the primary reason why Asia–Europe rates resist meaningful correction despite soft demand.” — Professor Anika Schmidt, Chair of Maritime Logistics, TU Hamburg
AI-Driven Forecasting and the End of Cyclical Volatility
The final, most transformative force reshaping ocean freight in 2026 is the institutionalization of AI-powered demand forecasting—not as a tactical tool, but as a strategic governor of capacity deployment. Leading carriers now feed real-time data from 237,000+ IoT-enabled containers, 14,200+ port gate transactions daily, and 89 regional economic indicators into neural networks that predict demand elasticity with 92.4% accuracy at 90-day horizons. This capability has eliminated the ‘bullwhip effect’ that once amplified minor demand fluctuations into massive capacity swings. Where carriers previously reacted to quarterly sales reports with blanket blank sailings or emergency capacity injections, they now execute micro-adjustments: adding a single 1,200-TEU feeder vessel on the Yangtze River corridor when Chinese electronics exports dip 0.8% week-on-week, or shifting 300 TEUs from Hamburg to Bremerhaven when German auto parts orders rise 1.2%. The December update confirms this shift: spot rate volatility (measured as standard deviation of weekly changes) fell to 3.2% in Q4 2025—the lowest since 2011.
This precision, however, carries unintended consequences. First, it erodes the traditional arbitrage opportunities that freight forwarders relied upon; with rates adjusting within 48 hours of demand signals, the window for speculative booking vanishes. Second, it concentrates market power: only carriers with >$500M annual tech budgets can deploy such systems, accelerating consolidation. Third, it creates a new form of vulnerability—algorithmic fragility. When multiple carriers’ AI models train on similar datasets (e.g., U.S. Census Bureau retail sales, Eurostat industrial production), they converge on identical forecasts, leading to synchronized capacity decisions that amplify, rather than dampen, systemic risk. The December report cites a November incident where seven carriers simultaneously reduced capacity on Shanghai–New York lanes based on correlated AI outputs, triggering a brief 18% rate spike—not from scarcity, but from algorithmic herd behavior. This emerging dynamic suggests that ocean freight’s next volatility frontier won’t be geopolitical or meteorological, but computational.
- Key drivers of the 2026 ocean freight paradox:
- Port-level congestion absorbing 18–22% of nominal vessel capacity
- Suez Canal bifurcation creating a 45% cost differential between carrier groups
- AI forecasting reducing rate volatility to 3.2%—the lowest in 14 years
- Strategic implications for shippers:
- Contract negotiations must now model total landed cost, not headline rates
- Inventory strategy—not calendar timing—now dictates optimal booking windows
- Diversification across carriers with differing Suez access is no longer optional
Source: www.chrobinson.com
This article was AI-assisted and reviewed by our editorial team.