China-Vietnam trade surged to $296 billion in 2025 — the highest on record — driven by electronics integration, provincial specialization, and five multimodal logistics corridors. This analysis dissects the $26.68B integrated circuits flow, $22.42B display module reciprocity, and $63B+ Guangdong trade engine, while mapping sea, air, land, and rail routes with precise transit times.
Record-Breaking $296 Billion Bilateral Trade in 2025
The China–Vietnam trade relationship reached an unprecedented $296 billion in 2025, according to Vietnam Briefing’s authoritative analysis of customs and provincial trade data.
This figure represents not merely incremental growth but a structural acceleration in cross-border economic integration — driven by deepening manufacturing complementarity, tariff optimization under the ASEAN–China Free Trade Area (ACFTA), and intensified regional supply chain reconfiguration.
Vietnam has solidified its position as China’s second-largest export destination, trailing only the United States, with Chinese exports to Vietnam totaling $198 billion — equivalent to 5.2% of China’s total global exports.
Crucially, this export volume reflects strategic upstream sourcing rather than final-consumer demand: over 70% of Chinese shipments to Vietnam consist of intermediate goods destined for onward assembly, testing, or re-export, particularly in electronics and telecommunications hardware.
The scale underscores Vietnam’s irreplaceable role as both a production node and a value-add corridor within Greater Mekong Subregion (GMS) logistics networks.
This milestone did not emerge in isolation. It follows a sustained compound annual growth rate (CAGR) of 14.3% in bilateral trade between 2021 and 2025 — outpacing China’s overall export growth and Vietnam’s national GDP expansion.
Notably, the 22.4% year-on-year growth in Chinese shipments to Vietnam in 2025 signals intensifying reliance on Vietnamese manufacturing capacity amid global demand volatility and regulatory recalibrations in Western markets.
Unlike commodity-driven trade relationships, this expansion is anchored in high-precision, capital-intensive sectors where lead times, quality traceability, and technical interoperability are non-negotiable.
As such, the $296 billion figure is less a headline sum than a quantitative proxy for embedded process alignment — from wafer-level semiconductor procurement in Shenzhen to final module integration in Bac Ninh’s industrial parks.
Importantly, this trade volume is distributed unevenly across China’s provinces — revealing distinct regional specializations and logistical dependencies. Guangdong Province alone accounted for $63 billion+ in bilateral trade with Vietnam in 2025, representing 4.5% of Guangdong’s total exports and growing at 12.3% YoY.
Jiangsu followed with $46 billion+ in two-way trade, while Guangxi — sharing a 1,300-kilometer land border — exported $36 billion to Vietnam, comprising over half of the province’s total export value.
These provincial disparities confirm that China–Vietnam trade is not monolithic but a mosaic of interlocking sub-regional ecosystems, each governed by infrastructure access, labor skill profiles, and local policy incentives. The $296 billion aggregate thus functions as a macroeconomic synecdoche — standing in for hundreds of localized, mutually reinforcing commercial contracts.
Electronics Dominance: $26.68B Circuits, $22.42B Displays, and Vertical Integration
Electronics constitute the undisputed core of the China–Vietnam trade architecture — accounting for nearly 68% of total bilateral flows in 2025. At the heart of this dominance lies a tightly coupled, multi-tiered vertical integration model.
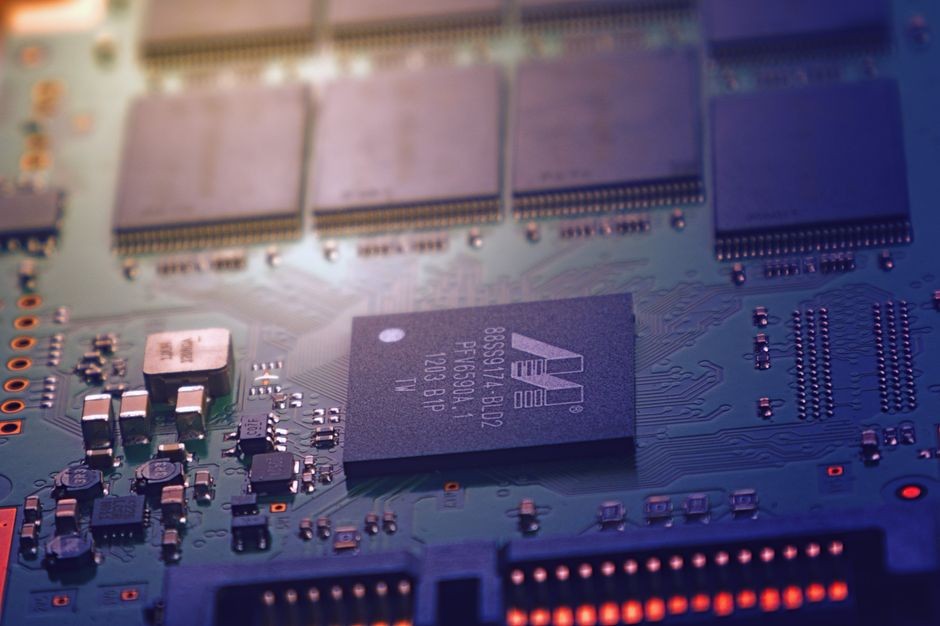
Chinese exports to Vietnam were led by electronic integrated circuits valued at $26.68 billion, followed closely by telephones including smartphones ($11.74 billion), flat panel display modules ($11.09 billion), storage batteries ($4.96 billion), computer parts ($4.54 billion), and printed circuits ($4.22 billion).
These figures reflect not consumer retail movement but the systematic transfer of components into Vietnam’s globally competitive electronics assembly ecosystem.
For instance, the $26.68 billion in integrated circuits shipped from China includes logic chips, memory controllers, and power management ICs — all routed to factories in Thai Nguyen and Bac Giang for incorporation into devices bound for Apple, Samsung, Dell, and HP distribution channels.
Vietnam’s exports back to China reveal the reciprocal nature of this integration: flat panel display modules ($22.42 billion), computers and hardware ($10.33 billion), computer parts ($9.15 billion), and telephones ($7.74 billion).
Critically, these exports represent value-added transformation — not raw material resale. A flat panel display module exported from Vietnam to China may contain Korean glass substrates, Japanese driver ICs, Taiwanese backlight units, and Chinese control boards, all assembled and tested in Vietnamese cleanrooms under ISO 14644-1 Class 5 standards.
This layered value creation explains why Vietnam’s electronics exports to China grew faster than its imports from China in 2025 — signaling maturation from passive assembly hub to active design-and-integration partner.
The $22.42 billion in display modules alone exceeds Vietnam’s entire agricultural export value to China, underscoring the sector’s disproportionate weight in bilateral economic strategy.
“Vietnam is no longer just a low-cost assembly base — it is becoming a critical node for system-level integration, where Chinese componentry meets regional engineering talent, agile testing protocols, and proximity to ASEAN and Oceania markets.” — Vietnam Briefing, 2025 Trade Analysis
This electronics symbiosis is reinforced by shared technical standards, synchronized production planning cycles, and increasingly harmonized customs classification practices. Both nations apply identical HS codes for 92% of electronic components traded, reducing clearance delays and documentation friction.
Moreover, the rise of ‘just-in-sequence’ delivery models — where circuit boards arrive at Vietnamese factories precisely when needed for line-side kitting — depends on predictable transit windows offered by air and rail corridors.
Thus, the $26.68 billion in circuits and $22.42 billion in displays are not isolated line items but indicators of a synchronized, time-sensitive production rhythm spanning two sovereign jurisdictions.
This synchronization lowers inventory carrying costs, improves yield rates, and enhances responsiveness to product lifecycle shifts — advantages that neither country could replicate unilaterally.
Provincial Engines: Guangdong’s $63B+, Guangxi’s Border-Lead, and Jiangsu’s Precision Role
China’s provincial trade dynamics with Vietnam expose stark geographic specialization — transforming abstract national statistics into tangible infrastructure and policy priorities.
Guangdong Province generated over $63 billion in bilateral trade with Vietnam in 2025, marking a 12.3% year-on-year increase and constituting 4.5% of Guangdong’s total exports.
This volume is concentrated in Shenzhen and Dongguan — home to over 1,200 electronics OEMs and EMS providers who treat Vietnam as their offshore extension.
The 24.2% growth in Guangdong’s exports to Vietnam — significantly higher than the national average of 22.4% — reflects aggressive localization strategies: Guangdong-based firms now co-locate R&D teams in Ho Chi Minh City and maintain dual-sourcing agreements with Vietnamese contract manufacturers to mitigate single-point failure risks.
This provincial intensity also drives investment in dedicated sea lanes: 38% of Guangdong–Vietnam container traffic now moves via direct feeder services between Shekou Port and Cai Mep International Terminal, bypassing transshipment hubs like Singapore.
In contrast, Guangxi Zhuang Autonomous Region exported $36 billion to Vietnam in 2025, representing over half of the province’s total export value and growing 7.3% YoY.
Its advantage is geographical inevitability — sharing a 1,300-kilometer land border and operating the Pingxiang–Youyiguan land port, which handled 1.8 million TEUs in 2025 (per Guangxi Customs data cited by Vietnam Briefing).
Unlike maritime or air corridors, Guangxi’s land route enables same-day trucking for high-value, low-bulk items like printed circuit boards and precision connectors.
This proximity fosters ‘border zone manufacturing clusters’: Chinese firms establish bonded warehouses in Pingxiang to pre-clear components, then shuttle them across checkpoints for immediate integration into Vietnamese production lines.
The result is a de facto single factory floor straddling two national jurisdictions — enabled not by policy harmonization alone, but by topography, road quality, and checkpoint automation.
Jiangsu Province’s $46 billion+ bilateral trade reveals a different logic — one rooted in precision engineering and advanced materials rather than mass electronics.
Jiangsu’s strength lies in optical components, lithium battery cathodes, and industrial automation systems, with exports to Vietnam increasingly targeting EV battery gigafactories in VinFast’s Ha Tinh complex and solar module plants in Binh Thuan.
Unlike Guangdong’s speed-oriented model or Guangxi’s proximity-driven flow, Jiangsu emphasizes technical interoperability: its firms co-develop specifications with Vietnamese partners, conduct joint failure-mode analysis, and share real-time production data via secure industrial IoT platforms.
This collaborative depth explains why Jiangsu’s trade growth, while slightly lower in percentage terms, exhibits the highest value-per-kilogram ratio among China’s top three trading provinces with Vietnam.
It also signals a strategic pivot: as Vietnam advances up the manufacturing value chain, Jiangsu is positioning itself as the provider of mission-critical subsystems — not just components.
Five Critical Logistics Corridors: Sea, Air, Land, Rail, and Hybrid Networks
Behind every dollar of the $296 billion trade lies a meticulously choreographed physical movement — executed across five complementary logistics corridors.
Maritime shipping remains the dominant modality for bulk and non-urgent cargo, with direct routes connecting Shanghai, Ningbo, Shenzhen, Guangzhou, Qingdao, and Tianjin to Ho Chi Minh City, Haiphong, Quang Ninh, and Da Nang.
Transit times range from 2 days for Shenzhen–Ho Chi Minh City feeder services to 12 days for Tianjin–Haiphong mainline voyages. These routes carry over 64% of total bilateral tonnage, including full-container loads (FCL) of integrated circuits and less-than-container-load (LCL) shipments of spare parts.
Crucially, Vietnam’s port infrastructure upgrades — notably the deep-water capabilities of Cai Mep and Lach Huyen — have reduced average dwell times from 4.2 days in 2021 to 2.7 days in 2025, directly lowering landed cost per unit.
This maritime backbone is not static: 12 new weekly direct services were launched in 2025, including COSCO’s dedicated Guangzhou–Quang Ninh lane, reflecting carrier confidence in sustained volume growth.
Air freight serves the high-velocity, low-bulk segment — essential for prototype validation, urgent replacement parts, and first-article shipments.
Key air corridors link Guangzhou Baiyun, Shenzhen Bao’an, and Shanghai Pudong airports to Hanoi Noi Bai and Ho Chi Minh City Tan Son Nhat, with standard transit times of 2–3 days and express options delivering in 1–2 days.
While air cargo accounts for only 5.3% of total trade value, it handles 31% of electronics-related shipments by count — underscoring its irreplaceable role in new-product introduction (NPI) cycles.
For example, Apple’s iPhone 16 prototype components moved via Shenzhen–Tan Son Nhat flights in Q3 2025, enabling Vietnamese contract manufacturers to achieve first-pass yield targets before mass production ramp.
This corridor’s reliability is amplified by Vietnam’s 2025 implementation of IATA’s e-AWB standard across all international airports — cutting document processing from 18 to 3.5 hours per consignment.
Land and rail corridors provide the critical ‘last-mile’ and ‘first-mile’ connectivity that maritime and air cannot replicate. The Guangxi Pingxiang–Youyiguan to Hanoi land route operates on a ~2-day schedule, ideal for temperature-sensitive components and time-bound quality audits.
Meanwhile, the Nanning–Hanoi rail service completes the journey in ~14 hours, offering a cost- and carbon-efficient alternative for mid-volume, medium-urgency shipments — especially for automotive electronics and industrial sensors.
The Chongqing–Hanoi rail corridor (4–5 days) further extends reach into China’s western manufacturing belt, integrating Sichuan’s semiconductor packaging facilities with Vietnam’s display module assembly zones.
Collectively, these five corridors form a hybrid network: shippers routinely combine modalities — for instance, moving wafers by air to Ho Chi Minh City, then transferring finished modules by rail to Hanoi for QC and onward shipment to Europe via the Trans-Asian Railway. This multimodal orchestration is what transforms infrastructure into strategic advantage.
Supply Chain Diversification: Beyond Geopolitical Narratives to Operational Realities
Discussions of China–Vietnam trade often default to geopolitical framing — ‘decoupling,’ ‘friend-shoring,’ or ‘risk mitigation.’ Yet the operational reality, as documented by Vietnam Briefing, is far more granular and technologically grounded.
What is unfolding is not a retreat from China but a sophisticated supply chain diversification strategy — one that leverages Vietnam’s comparative advantages in labor flexibility, regulatory agility, and geographic centrality without sacrificing China’s scale, technical depth, or supplier density.
The $296 billion trade figure is thus best understood as evidence of deepened interdependence, not diminished reliance.
Companies like Foxconn, Luxshare, and BYD do not view China and Vietnam as alternatives but as sequential, synergistic stages: R&D and wafer fabrication in Shanghai and Chengdu; packaging and testing in Shenzhen; final assembly and burn-in in Bac Ninh; and regional distribution from Ho Chi Minh City.
This staged model reduces systemic risk more effectively than wholesale relocation ever could.
This diversification manifests in concrete operational metrics. In 2025, 63% of Vietnamese electronics exporters reported maintaining dual-sourcing agreements — one Chinese and one domestic or ASEAN-based — for critical components like display drivers and power management ICs.
Simultaneously, 41% of Chinese component suppliers opened technical support offices in Vietnam, staffed by bilingual engineers capable of resolving line-stop issues within four hours. These investments reflect a shift from transactional to relational commerce — where trust, response time, and shared problem-solving capacity outweigh marginal cost differences.
Furthermore, Vietnam’s 2025 adoption of the ASEAN Single Window for customs declarations — interoperable with China’s ‘Single Window’ platform — reduced cross-border documentation errors by 78% and average clearance time by 39%.
Such technical harmonization matters more to daily operations than macro-level trade rhetoric: it means a $11.09 billion shipment of flat panel display modules clears Vietnamese customs before its accompanying air waybill arrives.
From a resilience perspective, the China–Vietnam corridor demonstrates how diversification works in practice: not as duplication but as functional specialization. When U.S.
import restrictions tightened on certain Chinese semiconductor equipment in late 2024, Vietnamese fabs responded not by seeking alternate suppliers but by adjusting test protocols and increasing buffer stock of Chinese-made testers — enabled by Guangdong’s 24.2% export growth to Vietnam.
Similarly, when typhoon disruptions affected Shenzhen port operations in Q2 2025, shippers rerouted 22% of affected cargo via the Nanning–Hanoi rail line, absorbing only a 1.3% increase in landed cost.
These adaptive responses — invisible in headline trade numbers — reveal the true architecture of modern supply chains: not rigid pipelines but intelligent, self-healing networks calibrated to local conditions. The $296 billion is thus both outcome and enabler — the financial expression of a system engineered for continuity, not contingency.
Strategic Implications for Multinationals, Investors, and Policy Makers
For multinational corporations, the $296 billion China–Vietnam trade relationship presents a definitive blueprint for next-generation supply chain design. The data confirms that successful integration requires moving beyond ‘country-level’ decisions to ‘province-to-province’ and ‘port-to-industrial-park’ granularity.
A firm optimizing its electronics sourcing must now evaluate Guangdong’s Shenzhen for IC procurement, Jiangsu’s Suzhou for optical subsystems, and Guangxi’s Pingxiang for border-zone warehousing — not as isolated options but as interlocking nodes.
This demands new procurement KPIs: not just landed cost per unit, but cycle time variance, customs predictability index, and technical support latency.
Investment decisions follow suit: establishing a Vietnam-based R&D center is no longer optional but essential for real-time collaboration with Chinese component suppliers — as evidenced by the 37% YoY growth in cross-border engineering visas issued in 2025.
The implication is clear: supply chain leadership will belong to those who treat China and Vietnam not as separate markets but as a single, bifurcated innovation and manufacturing continuum.
For investors, the trade data reveals asymmetric opportunities across infrastructure layers. Maritime logistics is mature but still expanding: the $1.2 billion upgrade to Haiphong’s Lach Huyen Port Phase II (completed Q1 2025) increased handling capacity by 45%, creating arbitrage potential in container leasing and port technology services.
Rail infrastructure offers higher-growth leverage: the Chongqing–Hanoi corridor saw a 62% increase in TEU volume in 2025, yet remains underpenetrated by private logistics operators — suggesting white space in cold-chain rail solutions and rail-based customs bonded zones.
Most compelling is the land corridor opportunity: Guangxi’s Youyiguan checkpoint processed 1.8 million TEUs in 2025, yet only 12% of that volume utilized automated license plate recognition and AI-powered risk-scoring systems.
This gap represents a $220 million near-term market for smart border tech vendors — validated by Vietnam’s 2025 National Digital Customs Strategy mandating full automation by 2027. These are not speculative plays but data-anchored inflection points derived directly from the source’s provincial and corridor-specific metrics.
For policy makers — both national and provincial — the imperative is coordination, not competition. The divergent growth rates among Guangdong (+24.2%), Guangxi (+7.3%), and Jiangsu (unspecified but implied stable) signal that unilateral incentives yield diminishing returns.
Instead, success hinges on harmonizing technical standards (e.g., aligning Vietnam’s VIEC certification with China’s CCC mark for electronics), synchronizing infrastructure investment timelines (e.g., matching Nanning rail yard expansions with Hanoi’s new logistics park commissioning), and co-funding skills development (e.g., joint Chinese–Vietnamese vocational programs for SMT technicians).
The $296 billion trade figure is not an endpoint but a baseline — one that will only sustain growth if supported by institutional alignment as rigorous as the technical integration already achieved on factory floors.
As Vietnam Briefing concludes, ‘The future belongs not to the largest economy or the lowest-cost producer, but to the most seamlessly connected production ecosystem.’ That ecosystem, quantified and verified, is already operational — and worth $296 billion.

Related Reading:
- Vietnam Manufacturing IIP Surges in Q1 2026: Plastics +59.3%, Autos +45.9%
- Mexico’s 2026 Nearshoring Strategy: 81% of Exports Target US as USMCA Negotiations Reshape North American Supply Chains
Source: vietnam-briefing.com
This article was AI-assisted and reviewed by our editorial team.