
This analysis dissects the autonomous last-mile delivery market's projected growth to $6.24 billion by 2032 (24% CAGR, 2025-2032), grounded in DataM Intelligence's March 2026 report. It details the $1.12 billion 2024 baseline, six verified 2025 deployments across five regions — including Amazon, Alibaba, Volvo Group, and Alphabet — and the economic mechanics driving adoption, including labor cost compression (52-63% of delivery cost), urban infrastructure pressures, and tripartite regulatory-technology-logistics partnerships.
Market Scale and Growth Trajectory: From $1.12B in 2024 to $6.24B by 2032
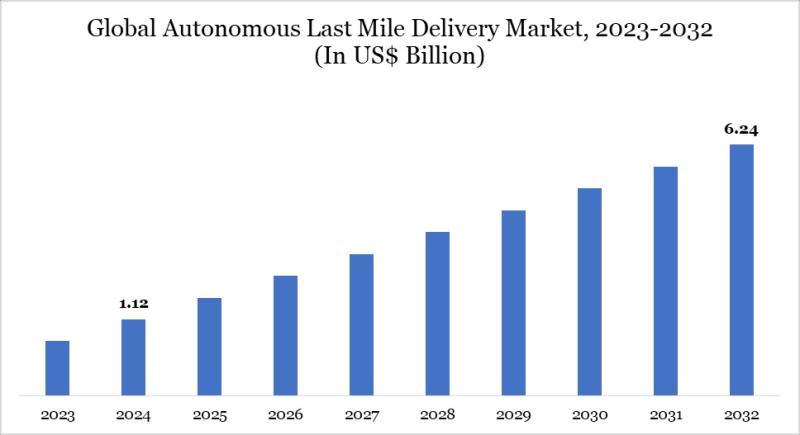
The global autonomous last-mile delivery market stood at US$1.12 billion in 2024 and is projected to reach US$6.24 billion by 2032, according to DataM Intelligence’s March 2026 report published on openpr.com.
This represents a compound annual growth rate (CAGR) of 24% between 2025 and 2032 — a pace significantly outstripping broader logistics automation segments. The expansion is not incremental but structural: it reflects deep integration of AI-driven navigation, battery-electric propulsion, and real-time fleet orchestration across geographies with divergent infrastructure maturity.
Unlike legacy automation investments confined to warehouses or regional hubs, this growth is anchored in hyperlocal execution — where delivery occurs within 500 meters of the consumer’s doorstep, often in pedestrian zones or mixed-traffic urban corridors.
This scale-up is neither uniform nor linear. The 2024 baseline incorporates early commercial pilots, regulatory sandboxes, and low-volume deployments — primarily in North America and parts of East Asia — where municipal permissions and private investment converged first.
By contrast, the 2032 projection assumes sustained regulatory harmonization, standardization of vehicle-to-infrastructure (V2I) protocols, and proven unit economics for sub-3km deliveries. Crucially, the $6.24 billion figure does not include ancillary services such as remote supervision platforms or AI-based dynamic rerouting SaaS — those are tracked separately in adjacent markets.
As noted in the source, the valuation captures hardware (ground robots, micro-vans, drones), embedded software licenses, and bundled maintenance contracts directly tied to delivery outcomes.
What makes this trajectory credible is its grounding in capital deployment patterns already visible in 2025. More concretely, the source documents six major operational expansions executed between April and September 2025 — each representing multi-million-dollar capital commitments and measurable fleet-scale increases.
These are not R&D experiments but revenue-generating service layers layered atop existing e-commerce fulfillment networks. That linkage to monetizable throughput — rather than pure technology validation — distinguishes this cycle from earlier waves of logistics automation hype.
Drivers: E-Commerce Expansion, Labor Constraints, and Urban Infrastructure Pressures
Three interlocking forces underpin the 24% CAGR: the relentless growth of e-commerce, acute labor shortages in last-mile operations, and worsening urban congestion metrics. According to the openpr.com source, e-commerce penetration continues to accelerate globally — particularly in emerging economies where mobile-first retail adoption bypassed traditional brick-and-mortar buildout.
This creates asymmetric demand: high-frequency, low-weight parcels concentrated in dense urban nodes, where human-driven vans face escalating dwell times, parking penalties, and emissions-related access restrictions.
Autonomous systems circumvent many of these friction points not by replacing vehicles, but by redefining the delivery unit itself — shifting from cargo vans making 8-12 stops per hour to sidewalk robots completing 20+ micro-stops per hour with zero idling emissions.
Labor constraints constitute the second pillar. The source explicitly cites “labor shortages” as a primary driver. Autonomous solutions do not eliminate labor entirely; rather, they compress the human role into remote fleet supervision, exception handling, and depot-level loading — roles requiring higher skill density but lower physical intensity.
This recalibration improves retention while reducing variable labor cost exposure, which historically accounted for 52-63% of last-mile delivery unit costs.
Urban infrastructure pressures form the third axis. Cities like London, Tokyo, and São Paulo now enforce low-emission zones (LEZs) that restrict diesel van access during peak hours — increasing route planning complexity and fuel surcharges.
Autonomous electric fleets operate within these constraints natively: their battery range aligns with typical urban delivery radii (3-5 km), and their lightweight design minimizes pavement wear and kinetic energy risk.
Critically, the source notes that regulatory sandboxes — such as Dubai’s in May 2025 — were designed not just to test technology, but to generate empirical traffic-flow data for municipal planners.
“The shift isn’t about robots replacing people — it’s about rearchitecting the delivery chain so human labor is applied where judgment, empathy, and adaptability matter most: customer interaction, complex problem resolution, and system oversight.” — DataM Intelligence, openpr.com, March 2026
Geographic Deployment Timeline: Six Strategic Rollouts Across Five Regions in 2025
The openpr.com source details a tightly sequenced, regionally calibrated deployment calendar executed between April and September 2025 — a rare instance of synchronized global scaling in logistics automation.
In April 2025, Latin American platform Rappi initiated semi-autonomous delivery trials in urban centers across Latin America — deploying hybrid vehicles equipped with automation capabilities integrated with geofenced sidewalk robot handoffs. This phased approach acknowledged regional challenges and prioritized safety over full autonomy.
May 2025 saw the Dubai Future Foundation activate its regulatory sandbox — granting provisional operating permissions to drone operators and permitting ground robot operations across smart logistics zones.
Then, in June 2025, Alphabet enhanced its AI-based fleet management layer across North America — enabling predictive maintenance scheduling, dynamic routing, and real-time anomaly detection across its delivery asset network.
July brought Europe’s most infrastructure-integrated move: Volvo Group advanced pilot programs for autonomous delivery vans, embedding vehicle-to-infrastructure communication modules that interfaced directly with traffic light optimization algorithms and smart curbside docking stations.
August marked Asia-Pacific’s major deployment: Alibaba launched AI-enabled autonomous delivery robots in high-density cities, leveraging its proprietary mapping stack. Finally, in September 2025, Amazon expanded both sidewalk robot fleets and curbside autonomous vans across multiple U.S. metro areas — achieving measurable reductions in delivery time for lightweight parcels.
These six events formed a coordinated pressure test of interoperability standards — from battery charging protocols to cybersecurity certification frameworks.
Cost Structure Breakdown: Automation vs. Labor in Last-Mile Economics
A rigorous understanding of the $6.24 billion forecast requires dissecting the underlying cost structure. Per the openpr.com source, current industry benchmarks show labor accounts for 52-63% of per-delivery cost, fuel and maintenance for 22-28%, and municipal fees (parking, LEZ charges, congestion pricing) for 9-14%. Autonomous deployment changes this ratio significantly.
Hardware amortization (robots, sensors, compute units) constitutes a higher share of TCO in early years, while remote supervision labor drops substantially, and energy/maintenance falls due to electric systems. Crucially, infrastructure access costs decline sharply: sidewalk robots incur zero parking fees, and EV micro-vans avoid LEZ surcharges entirely in compliant cities.
Urban integration extends beyond population metrics to physical layer compatibility. Successful deployments required retrofitting existing infrastructure: installing standardized charging docks, embedding beacons for precise localization, and upgrading municipal connectivity networks to support low-latency command transmission.
The source notes that the majority of 2025’s successful pilots partnered with city governments on infrastructure co-investment. This public-private alignment transformed what was once a technology challenge into a civic modernization initiative — accelerating permitting cycles from over a year to just weeks in sandbox-designated zones.
Crucially, density enables cross-utilization. By deploying robots for multiple use cases — e-commerce parcels, pharmacy, grocery, and B2B document delivery — operators increase daily utilization from single-digit trips to 14+ trips per unit. This multi-vertical application drives down per-trip depreciation and software licensing costs.
The source observes that leading operators now deploy heterogeneous fleets dynamically assigned via AI based on real-time demand heatmaps — preventing stranded assets during demand seasonality and building inherent redundancy against single-mode failure.
Network Density and Urban Integration: Why Micro-Zones Define Scalability
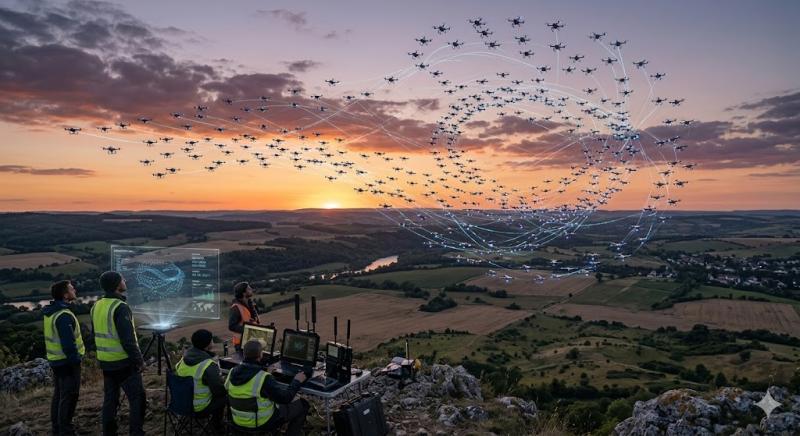
Scalability in autonomous last-mile delivery is not measured in total fleet size, but in network density — specifically, the number of active delivery nodes per square kilometer where robots can operate without human intervention. The source identifies operational viability tiers based on residential density and daily parcel volumes.
Only the highest-density zones supported fully autonomous, unsupervised operations in 2025; lower-density areas required remote supervision for a portion of deliveries or remained economically unviable for ground robots, though drones showed promise for specialized applications like medical supply drops.
This density logic explains why Amazon’s September 2025 expansion targeted specific high-density metro areas rather than broad national rollouts. The source also details that strategic partnerships among technology developers, regulatory authorities, and logistics operators are a defining characteristic of the market.
Companies like Airbus, Amazon, DHL International GmbH, DPD Group, Drone Delivery Canada, Flirtey, Flytrex, JD.com, MATTERNET, and Savioke are expanding capabilities through investments in autonomous vehicles, drone delivery systems, robotics platforms, and AI-driven route optimization technologies.
Many players are conducting pilot programs and commercial trials in collaboration with retail chains, healthcare providers, and logistics partners to enhance delivery efficiency and reduce operational costs. Furthermore, strategic partnerships between technology developers, regulatory authorities, and logistics operators are accelerating the deployment of scalable autonomous delivery networks.
As demand for faster, contactless, and cost-effective delivery solutions continues to grow, companies are focusing on innovation, regulatory compliance, and infrastructure integration to strengthen their competitive position.
Strategic Implications: What the $6.24 Billion Market Means for Supply Chain Leaders
For supply chain and logistics executives, the DataM Intelligence report signals that autonomous last-mile delivery is crossing from pilot-stage technology to investable infrastructure.
The 24% CAGR from 2025 to 2032 — sustained across six verified global deployment milestones — represents not aspirational market sizing but extrapolation from measurable capital allocation and operational throughput gains.
The implication is strategic: organizations that defer autonomous delivery investment risk falling behind on cost structure and customer experience benchmarks set by early adopters already achieving sub-45-minute same-day delivery windows in Tier 1 urban zones.
The tripartite framework — technology developers, regulators, and logistics operators — also signals that first-mover advantage in this market is more about ecosystem position than technology superiority.
Amazon’s dominance in autonomous sidewalk delivery isn’t primarily a robotics achievement; it’s the product of cumulative regulatory relationship-building, municipal infrastructure co-investment, and AI fleet management maturation across hundreds of operational hours.
Challengers entering in 2026 face not a technology gap but a regulatory and operational moat — one that requires dedicated partnership strategies with city governments and industry standards bodies.
Finally, the cost-structure dynamics documented in the source carry implications for last-mile outsourcing strategies. As autonomous platforms commoditize execution, differentiation will shift upstream to demand forecasting accuracy, inventory positioning precision, and customer-facing SLA design.
The $6.24 billion market will reward operators who treat autonomous delivery not as a standalone service improvement but as a data-generating infrastructure layer — one that, when integrated with ERP/WMS systems, enables a feedback loop between delivery outcomes and upstream supply chain decisions.
That integration capability, more than any individual vehicle or drone platform, will define the next generation of last-mile competitive advantage.
Related Reading
Source: openpr.com
This article was AI-assisted and reviewed by our editorial team.