Multimodal Service Providers Are Gracefully Capturing Market Share, But Will This Have a Counterproductive Effect on Price Growth?
This Week’s Chart: Rail Intermodal Loadings, Spot Rates – USA SONAR: ORAILL.USA, INTRM.USA
Intermodal demand is only 2% below the pandemic peak at the end of 2020, but spot rates are down by about 42%. Have railroads solved all their problems?
In 2023, both domestic and international intermodal loadings increased by 10%, yet spot rates dropped approximately 8%. This seems somewhat contradictory.
Typically, demand is highly correlated with price changes for most goods. However, due to excess capacity, this has not been the case in the domestic transportation market over recent years.
This summer, container imports surged and almost reached pandemic-era levels, which was the main driver of growth in US domestic freight demand.
During the pandemic, railroads were heavily criticized for their inability to handle record-breaking cargo volumes flooding into ports. Rail hubs and infrastructure around ports bore the brunt of criticism.
Fairly speaking, these volumes were unprecedented, and no one could have predicted them. Railroad companies were also motivated to cut costs as much as possible to boost investor profitability, which made them less adaptable.
Loss of Market Share
The historic demand growth coupled with limited infrastructure led to service failures, prompting shippers to shift a significant amount of cargo to the truckload market. From October 2020 to 2021, intermodal demand fell by 13%, while truckload tender volume increased by about 2%.
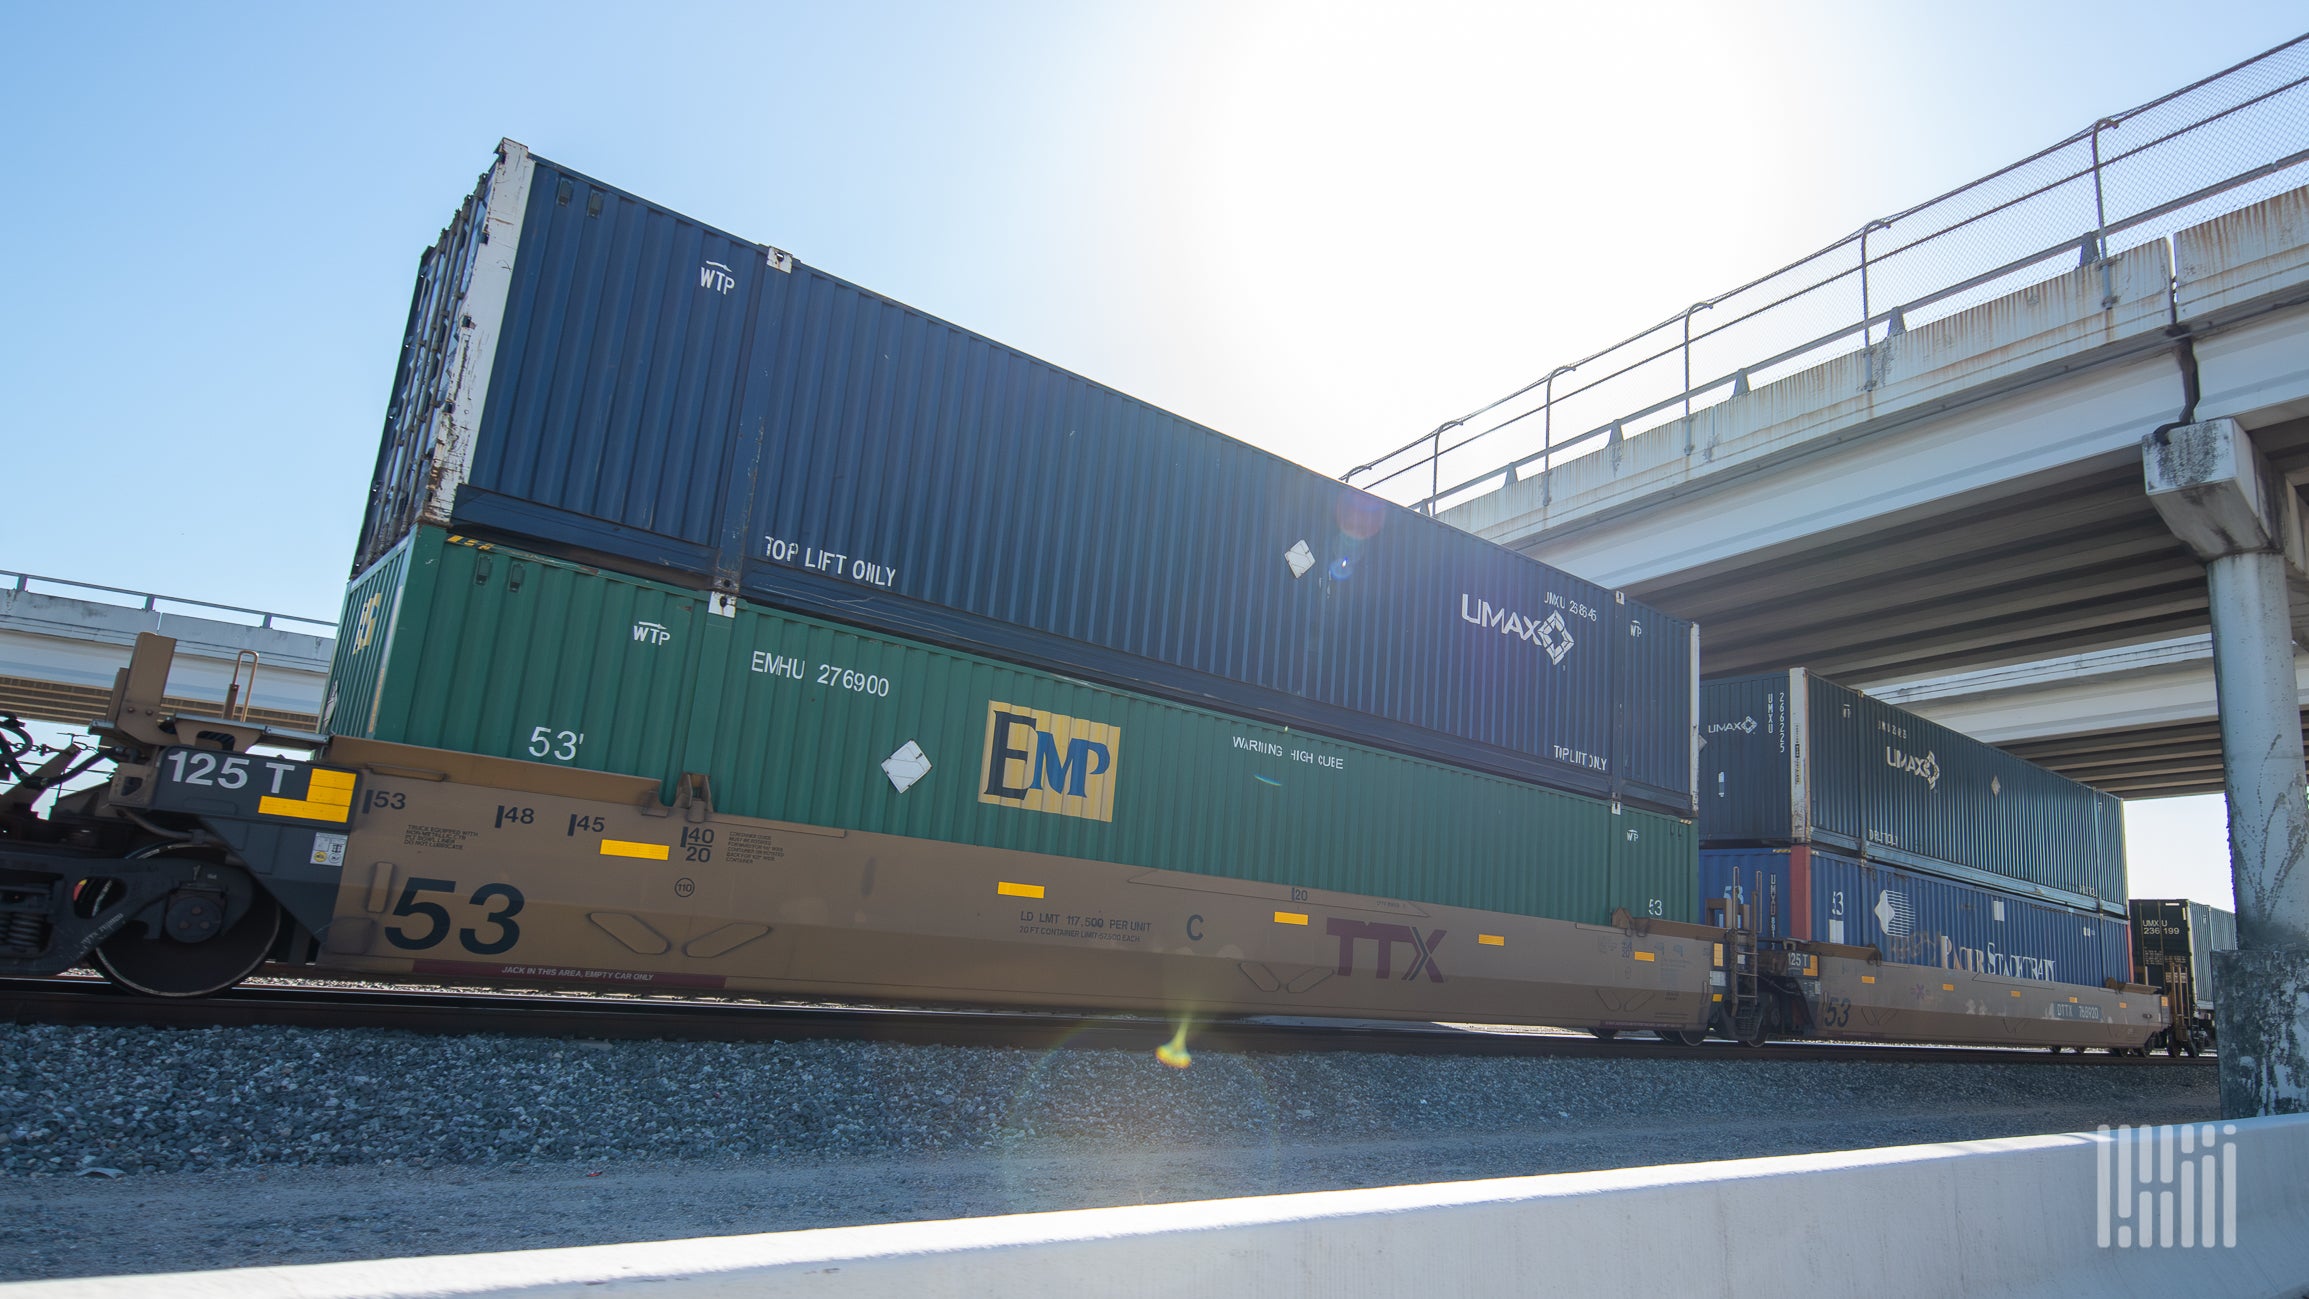
To regain market share, railroads had to invest in improving infrastructure and containers for future needs. With a new wave of import freight flooding into the port market, these investments seem to be paying off.
By late August, loaded container volumes grew by 13% year-over-year, while truckload tender volume only increased by 2%. Domestic loaded container volumes rose by 10%, and small international containers increased by 16%.
Sabotaging Themselves?
For railroads and intermodal providers, the growth in market share is positive, but the outcome may not be as advantageous as it appears. They are transporting more goods while also preventing disruptions in the truckload market, which keeps rates low.
The intermodal market relies on the truckload market—by absorbing some of the most disruptive cargo to keep truckload rates depressed—to boost intermodal prices.
Intermodal is primarily long-haul transportation, with the largest US intermodal route being from Los Angeles to Chicago. A single truck requires nearly four days for this trip, and return time is at least as long. With freight predominantly flowing west-to-east, finding enough cargo to profitably return to California poses a significant challenge.
For shippers, it’s a short-term win but with only slight improvements overall. Improvements in rail and port infrastructure undoubtedly enhance long-term efficiency and may help mitigate future market volatility. However, the growth of intermodal market share is merely a temporary means to maintain market looseness.
The longer the truckload market remains oversupplied, the more capacity will continue to exit. This will make truckload capacity more vulnerable to demand shocks in the future, driving up all rates.
About This Week’s Chart
This week’s chart from FreightWaves is selected from SONAR and provides interesting data points that describe the state of the freight market. From thousands of potential charts on SONAR, one is chosen to help participants understand real-time conditions in the freight market. Each week, a market expert posts the chart with commentary on the homepage. The chart then gets archived on FreightWaves.com for future reference.
SONAR aggregates data from hundreds of sources and presents it through charts and maps, offering industry insights that freight market experts care about in real-time.
The data science and product teams at FreightWaves release new datasets weekly and optimize the customer experience.
To request a SONAR demo, click here.
Zach Strickland, FW Market Expert & Analyst
Zach Strickland, known as the “Sultan of SONAR,” is responsible for weekly market updates. Zach is also one of FreightWaves’ market experts. With a degree in finance, Strickland began his career in banking before transitioning to the transportation industry, where he has worked across various roles and segments including truckload and LTL. He has over 13 years of experience in transportation, focusing on data, pricing, and analysis.
Source: FreightWaves