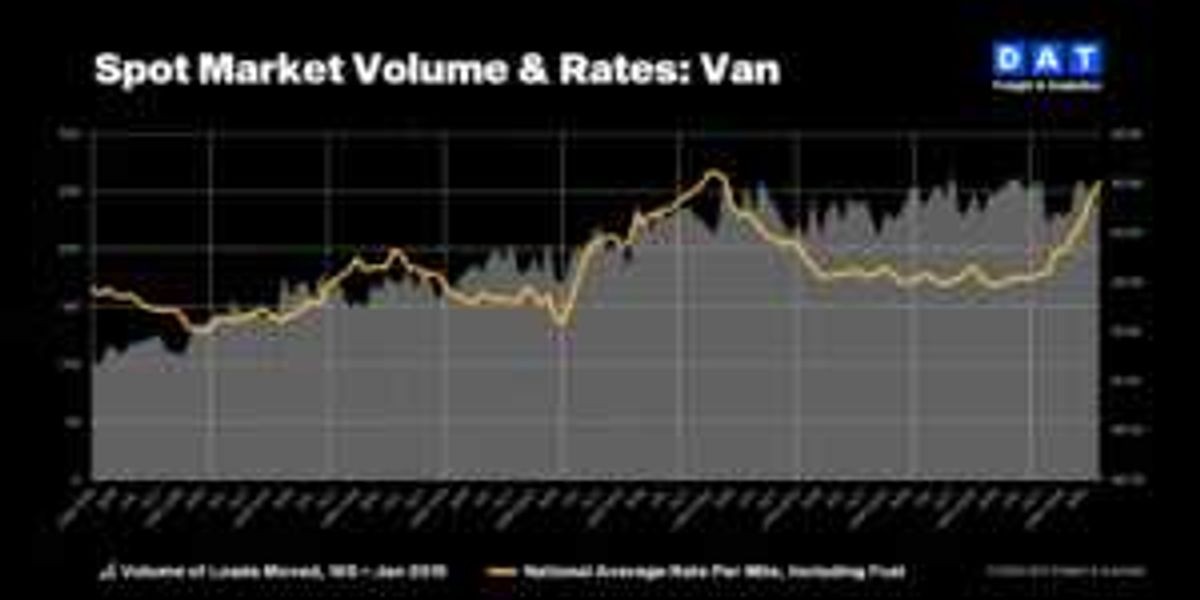
DAT Freight & Analytics reports that dry van spot rates exceeded contract rates for the first time since February 2022, while flatbed rates hit an all-time high in July 2026 — driven by tightening trucking capacity, not freight demand growth. Rates rose faster than volumes last month, confirming structural supply constraints. The trend aligns with analyses from FTR and U.S. Bank. Dean Croke, DAT industry analyst, attributes the shift to 'real capacity pressure.' Descartes’ $30 million acquisition of a South American routing firm and the Port of Savannah’s July 16, 2026 highway opening reflect industry responses to this tightness.
According to www.dcvelocity.com, dry van spot rates surpassed contract rates for the first time since February 2022, while flatbed spot rates hit a record high in July 2026 — driven not by surging freight demand, but by tightening trucking capacity.
Rate Recovery Driven by Capacity Constraints
Truckload rates are rebounding rapidly from a three-year recession, yet this recovery reflects constrained carrier supply rather than broad-based demand growth. According to DAT Freight & Analytics, the disparity between rising rates and flat freight volumes points decisively to capacity pressure. In June 2026, truckload rates climbed faster than freight volumes — a key indicator that supply, not demand, is shaping pricing dynamics.
The narrowing gap between spot and contract rates has persisted for more than one year, signaling sustained pricing power across the carrier base. As Dean Croke, industry analyst at DAT, explained:
“The difference between spot and contract rates has narrowed steadily for more than a year, and carriers are gaining pricing power across the board. Van spot beating contract for the first time in four years, and flatbed hitting an all-time high in the same month, shows real capacity pressure. If demand were driving this, volumes would be climbing too, and they’re not.” — Dean Croke, DAT industry analyst
Market Signals Confirm Structural Tightness
The July 2026 milestone — dry van spot rates exceeding contract rates — marks the first occurrence since February 2022. This reversal is historically rare and underscores structural imbalances in the over-the-road segment. Flatbed rates simultaneously reached an all-time high, reinforcing that capacity scarcity cuts across equipment types. Notably, these developments align with findings from independent analysts: transportation analytics firm FTR and freight payments manager U.S. Bank have both published recent reports reaching the same conclusion — rate strength stems from reduced available capacity, not freight volume expansion.
Freight volumes remained flat last month despite double-digit rate increases — a divergence that contradicts demand-led recovery models. The report notes that no meaningful uptick in tonnage or shipment count accompanied the rate surge, further validating the capacity thesis. Portland, Oregon-based DAT Freight & Analytics emphasized that this dynamic is now observable across multiple load boards and tender acceptance metrics.
Broader Industry Context and Implications
This capacity-driven pricing environment has tangible consequences for shippers and 3PLs alike. Contract negotiations are increasingly weighted toward carrier leverage, with many shippers reporting tighter service-level commitments and longer lead times for spot allocations. The trend also intersects with broader sectoral developments: Descartes recently acquired a South American last-mile routing firm for $30 million in early July 2026, reflecting intensified investment in visibility and routing efficiency amid constrained capacity. Meanwhile, the Port of Savannah is set to open a dedicated four-lane highway for truck freight on July 16, 2026, aiming to alleviate terminal congestion — a direct response to persistent drayage bottlenecks.
For supply chain professionals, the implication is operational: rate volatility is no longer primarily cyclical but structural, requiring revised modeling assumptions around lane coverage, tender rejection rates, and contingency planning. Unlike demand-driven spikes — which typically ease with seasonal or economic shifts — capacity-driven pressure persists until new entrants enter the market or regulatory changes (e.g., hours-of-service adjustments or CDL training incentives) meaningfully expand the driver pool. No such policy shift has been implemented as of mid-2026.
Source: DC Velocity
Compiled from international media by the SCI.AI editorial team.