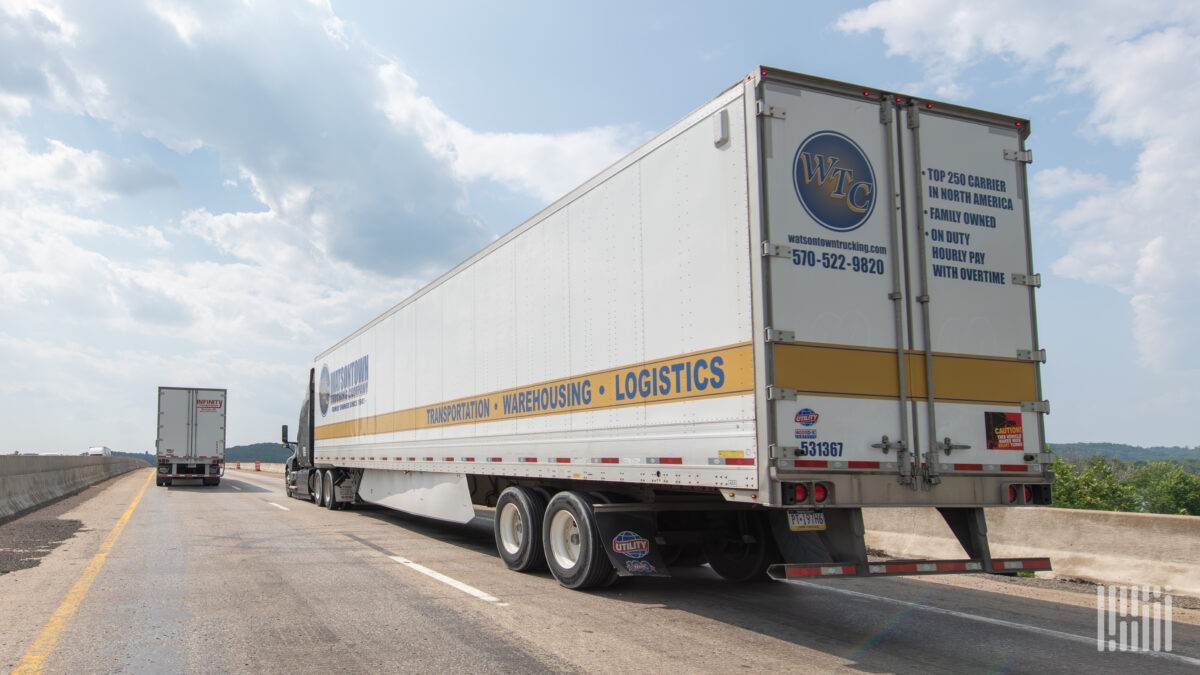
Average truckload haul distance in the U.S. has fallen 11% year-over-year, dropping from ~607 miles in June 2024 to just above 500 miles — a 21% decline overall. Despite rising demand (+10–15% YoY), tender rejection rates exceed 17% and spot rates are surging. The shrinkage reflects structural shifts: intermodal gains on long-haul lanes, Red Sea disruptions, just-in-case inventory drawdowns, and a surge in sub-250-mile regional moves. While import-driven Q4 long-haul demand may intensify capacity pressure, supply chains appear permanently reconfigured.
Truckload’s shrinking miles — FreightWaves SONAR Demo | SONAR Login | Customer Support | SONAR Demo | Subscribe | Newsletters Contact Us Brands Search AI Search Close Search for: Search Read Brands FreightWaves American Shipper Modern Shipper FreightWaves Checkpoint SONAR Trending Topics Startups Reindustrialization Global Supply Chain Trade and Compliance Borderlands: Mexico Fuel News Legal Issues Trucking Compliance Company Earnings Modes Truckload Less than Truckload (LTL) Parcel Freight Railroad Maritime Air Cargo Insights SONAR Chart of the Week State of Freight Insights #WithSONAR SONAR Freight Market Updates Sponsored Insights Warehouse In The Sky Insurance & Risk Management Watch FreightWaves Today What the Truck?!? Brake Check The Long Haul TruckTech Loaded & Rolling Listen Newsletters SONAR Learn More Request a Demo SONAR Knowledge Center SONAR API Awards FreightTech Awards Fraud Fighters Awards AI Excellence in Supply Chain Awards Shipper of Choice Awards Events Supply Chain AI Symposium Future of Rail Summit Enterprise Fleet Summit F3: Future of Freight Festival Resources Advertise Freight Industry White Papers FreightWaves Webinars About Us Our Mission Market Experts Editorial Team RSS Facebook Twitter LinkedIn YouTube Instagram ● Watch Now –> Click here to open Menu Click to close the product launchpad Home / News / Insights / Chart of the Week / Truckload’s shrinking miles Chart of the Week Chart of the Week Truckload’s shrinking miles Average distances have dropped 11% y/y for truckloads Zach Strickland, FW Market Expert & Market Analyst · Saturday, June 06, 2026 Chart of the Week: Outbound Average Length of Haul – USA SONAR: OALOHA.USA
Shrinking Load Lengths Persist Amid Tightening Market
Despite the ongoing tightening of the domestic truckload market, the trend of shrinking load lengths that began in 2024 shows little sign of reversing. Since June 2024, the average length of haul in SONAR’s tender data set has declined from approximately 607 miles to just above 500 miles — a 21% drop, with 11% of that occurring over the past year alone, making it a fairly linear trend. Is this part of a sustained structural change, or something that could flip in the near future and exacerbate current market conditions?
Longevity Suggests Structural Shift
Perhaps the most interesting characteristic of this trend is its longevity. Most freight trends emerge sharply or follow seasonal patterns. This one looks more like a shift in how shippers utilize trucks as they adapt their supply chain management strategies — which, if true, suggests a more permanent alteration of the market.
Capacity Implications Are Counterintuitive
The reason this trend matters is that longer lengths of haul occupy more capacity. Longer transit times mean trucks cannot pick up other freight. A load moving from Los Angeles to Chicago covers roughly 2,000 miles and occupies three to four days of a single truck’s time. A load moving from Atlanta to Nashville covers around 250 miles and occupies roughly half a day, depending on loading and unloading times.
In that sense, a shrinking length of haul should have freed up capacity over the past two years, as trucks are cycled more frequently — even despite the strengthening in demand seen recently (up approximately 10–15% year-over-year in early June). Yet tender rejections sit at multi-year highs above 17%, while spot rates are surging across all three main trailer types.
Intermodal Gains Drive Shorter Truckloads
The data suggests that one driver of deteriorating load lengths is the loss of share to railroads in the form of intermodal — a topic we have covered numerous times. Intermodal holds a strong cost advantage over trucking on longer transcontinental lanes but struggles to compete on shorter distances.
Intermodal lost share to trucking during the pandemic when it couldn’t keep pace with demand. Since then, railroads and carriers have invested in infrastructure and expanded capacity to handle greater volume and demand surges. Loaded international container volumes (ORAILINTL) were up approximately 11% year-over-year last week according to SONAR’s intermodal volume data, while domestic container volumes (ORAILDOML) were up 14%.
International container volumes are a direct derivative of imports, as containers are loaded from ships and port yards directly onto trains. Domestic containers typically originate in the U.S. and are transloaded at warehouses.
Cost vs. Service Trade-Offs Evolve
Intermodal has a cost advantage, but service favors trucking due to its ability to move directly in and out of shipper facilities with fewer touchpoints. Intermodal contract savings averaged between 10% and 20% in 2024 and 2025, but that gap has widened rapidly this year as truckload rates have climbed.
Intermodal pricing is closely tied to truckload, as railroads and carriers won’t leave money on the table. Rates are expected to rise for intermodal this year, but not enough to push loads back to trucking.
Service Needs and Inventory Strategy Shift
The deciding factor for whether a load moves by intermodal or truck is service. Shippers have had ample time to move freight domestically in recent years, as internationally sourced freight has been disrupted by growing global tensions. Houthi attacks in the Red Sea have altered shipping lanes for multiple years, disrupting service patterns. Unpredictable U.S. trade policy has also led many companies to import goods well ahead of expected demand. This just-in-case inventory strategy favors rail, since the extended lead time makes slower transit acceptable.
That dynamic has shifted in recent months, according to the Logistics Managers’ Index, which surveys hundreds of supply chain managers across a broad range of businesses. Inventory levels are now being managed just above replenishment as inventory carrying costs have surged.
Interestingly, this shift has not pushed load lengths higher. Imports have remained low relative to the previous two years, and most of the demand fueling the truckload market has come from moves under 250 miles, pushing carriers toward a more regionalized approach. The recent trend of shrinking load lengths is therefore less about modal shift alone and more about a disproportionate growth in short-distance moves.
Fourth-Quarter Outlook and Structural Questions
Most of the retail freight that dominates the fourth quarter arrives via ship in August and September. Will trucking see a surge in long-haul demand that further deepens the current capacity crunch later in the year — and how will transportation managers respond?
A last-minute import flood could strain transportation networks later in 2025, but it is unlikely to persist, as supply chains have been permanently altered to some degree. It also makes the prospect of a transcontinental railroad merger that much more intriguing.
Source: FreightWaves
Compiled from international media by the SCI.AI editorial team.