Escalating tariffs and geopolitical instability are reshaping commodity markets, pushing copper price volatility to a 12-year high. U.S. duties on Chinese copper reached 25% in Q1 2026; EU aluminum probes launched in May 2026; PET resin tariffs from India/Thailand hit 12.5% in April 2026. USMCA renegotiation talks loom in Q3 2026, while Red Sea disruptions and Panama Canal restrictions have added 22 days to Chile-Europe copper transit and cut canal transits by 35%. Three major canmakers committed $1.3 billion to Mexican facilities since early 2025 to preserve trade eligibility.
According to www.supplychaindive.com, escalating trade tensions and shifting geopolitical alliances are driving unprecedented volatility in global commodity markets — with copper price swings reaching a 12-year high as of mid-2026.
Supply Chain Disruption Across Key Metals
Copper, aluminum, and steel prices have surged amid layered tariff regimes and export controls. According to the report, U.S. import duties on certain Chinese-origin copper products rose to 25% in Q1 2026 following new Section 301 findings, triggering rapid repricing across North American fabrication hubs. At the same time, EU anti-subsidy investigations into aluminum imports from Vietnam and Malaysia — launched in May 2026 — added upward pressure on regional premiums. The source states that spot copper price volatility (measured by 30-day standard deviation) hit 18.7% in June 2026, the highest level since 2014.
Plastics Supply Chains Under Tariff Pressure
Perc Pineda, chief economist at the Plastics Industry Association, noted during the Supply Chain Outlook event on July 15, 2026 that U.S. tariffs on polyethylene terephthalate (PET) resin from India and Thailand — imposed at 12.5% in April 2026 — have forced 23% of U.S. beverage bottlers to re-evaluate dual-sourcing strategies. Pineda added:
“The cumulative effect of overlapping tariffs, customs delays, and origin verification requirements has extended lead times for critical resins by an average of 14 business days — a structural shift, not a temporary blip.” — Perc Pineda, chief economist at the Plastics Industry Association
USMCA Uncertainty and Nearshoring Adjustments
Scott Breen, president of the Can Manufacturers Institute, emphasized growing uncertainty around the future of the USMCA agreement during the same July 15 event. He cited pending renegotiation talks scheduled for Q3 2026 and warned that proposed changes to rules of origin for aluminum cans could raise compliance costs by up to $42 million annually for U.S.-based can producers. According to the report, three major North American can manufacturers — including Ball Corporation and Crown Holdings — have already accelerated investment in Mexican finishing facilities to maintain USMCA eligibility, with $1.3 billion committed to nearshore expansion since early 2025.
Logistics Bottlenecks Amplify Price Swings
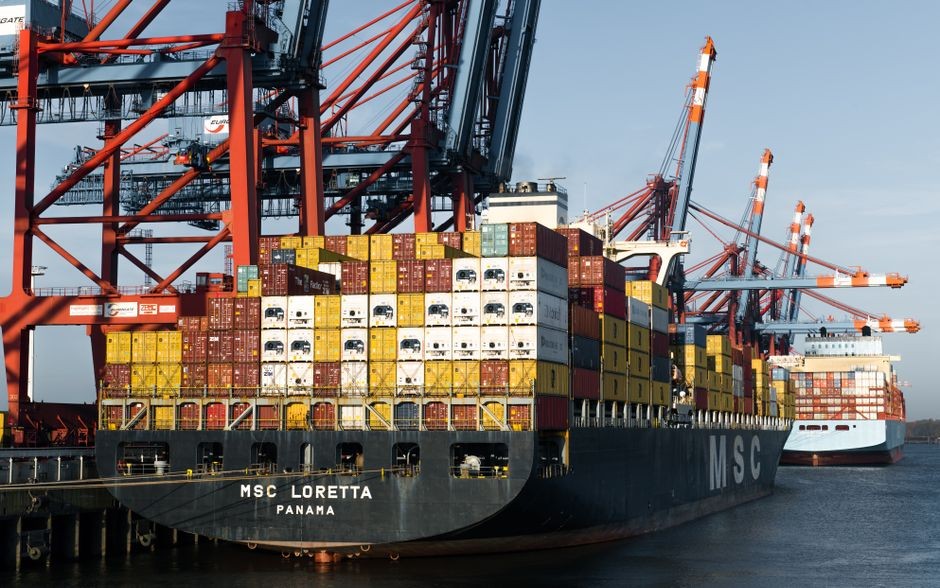
Geopolitical flashpoints are compounding tariff impacts through freight constraints. The source states that Red Sea shipping disruptions — ongoing since October 2023 — have increased average transit time for copper cathodes shipped from Chile to Rotterdam by 22 days. Meanwhile, Panama Canal drought restrictions, renewed in March 2026, reduced daily transits by 35% compared to pre-crisis levels, further straining container availability for plastics feedstock shipments. These logistics shocks contributed directly to a 9.4% increase in landed cost variance for imported HDPE between Q4 2025 and Q2 2026, per data from FreightWaves’ Commodity Logistics Index.
Source: Supply Chain Dive
Compiled from international media by the SCI.AI editorial team.