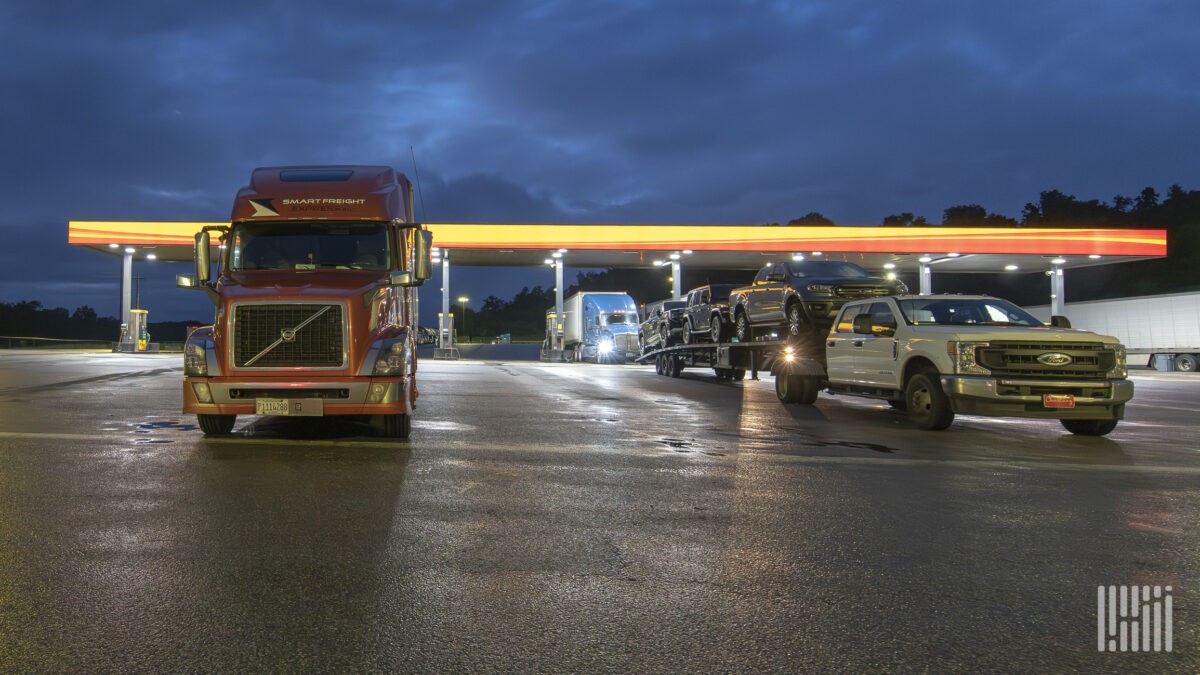
Two trucks on identical routes can differ by 30% or more in fuel economy—not due to luck or equipment, but five controllable factors: speed, driving style, aerodynamics, tire management, and maintenance discipline. Research shows speed alone drives a 27% fuel penalty at 75 mph vs. 65 mph; aggressive driving cuts efficiency by 15–40%; trailer side skirts yield 7.4% savings; and chronic idling costs $4,000–$6,000 annually per truck. NACFE and ATRI data confirm disciplined operators achieve 7.8 MPG versus the 6.9 MPG industry average—translating to ~$17,000/year in fuel savings per truck at $5.60/gallon.
Two trucks running the same corridor can burn fuel at rates that differ by 30 percent or more, and almost none of that gap has to do with luck or the truck itself. It comes down to five controllable factors, and understanding where your money is going is the first step to getting it back.
The Gap Is Bigger Than You Think
Picture two owner-operators, both running a regular Midwest corridor. Same general freight, similar weights, comparable miles per week. One of them is averaging somewhere around 7.5 to 7.8 miles per gallon. The other is pulling 6.1 to 6.3. On a week where each truck burns 400 gallons of diesel, that MPG gap represents roughly 60 to 80 extra gallons gone out of one guy’s pocket at current pump prices hovering around $5.60 per gallon according to AAA’s weekly tracking as of late May 2026. That’s $336 to $448 in a single week. Nearly $20,000 a year, in a market where margins are tight enough that many operators are running close to breakeven.
The North American Council for Freight Efficiency (NACFE) tracked 14 fleets operating 75,000 trucks and found that disciplined operators were consistently achieving 7.8 MPG or better while the industry average sat around 6.9 MPG. That spread is not an accident of equipment or route. It is the compounding result of decisions made every hour behind the wheel, and a handful of maintenance habits that either protect or bleed fuel economy on every trip. According to ATRI’s 2025 Analysis of the Operational Costs of Trucking, fuel cost operators 48 cents per mile in 2024, down from the painful 64 cents per mile seen in 2022, but still a dime higher than pre-pandemic levels. At 48 cents per mile, fuel remains the single largest line item outside of driver wages. What ATRI’s data cannot show is how much of that 48-cent average is inflated by behavior and maintenance gaps that are entirely within an operator’s control.
Speed: The Heaviest Tax You’re Voluntarily Paying
Speed is the dominant variable in fuel consumption, and it is not close. The American Trucking Associations has documented that running at 75 miles per hour uses 27 percent more fuel than running the same truck at 65 mph. For every one mile per hour you push over 65, you are giving back roughly 0.14 miles per gallon, according to research cited by the National Geographic Intelligent Fuel study, with the penalty doubling if the truck’s aerodynamics are poor.
The physics explanation is straightforward. Aerodynamic drag does not scale linearly with speed. It scales with the square of your speed. So the faster you go, the disproportionately harder your engine has to work to punch the truck through the air. A driver running 72 mph on a flat interstate is not running 10 percent harder than the 65 mph driver. The drag load is substantially worse than that.
At current diesel prices, consider the real math. A truck averaging 120,000 miles per year at 6.3 MPG consumes roughly 19,048 gallons annually. The same truck, same route, at 7.5 MPG consumes 16,000 gallons. That difference of 3,048 gallons at $5.60 per gallon is $17,069. That number does not require new equipment, it does not require a loan or a lease, it simply requires a different right foot.
The counterargument is always time. Running faster gets you there sooner, gets you reloaded sooner. That logic is not wrong, but it requires honest feedback to evaluate. A driver covering 600 miles at 72 mph versus 65 mph saves roughly 55 minutes of drive time and spends roughly 24 additional gallons of fuel. At $5.60 per gallon, that’s $134.40 paid to save less than an hour. Whether that trade is worth it depends on your reload situation. For most owner-operators running load boards, that 55 minutes rarely translates to a material income difference at the destination.
Driving Style: The Part No One Likes to Hear
Speed gets most of the attention, but the way a driver manages throttle and momentum is nearly as significant. Engine manufacturers across the board have indicated that driver behavior accounts for roughly 30 percent of fuel economy variation. NACFE’s research on driver coaching programs confirmed that behavior modification delivers 42 percent of total achievable fuel savings, more than any other single factor.
The main culprits are aggressive acceleration and failure to use momentum. A truck that gets hammered on takeoff from every light, toll plaza, or merge burns fuel in the acceleration phase that a smooth-footed driver never spends. MIT research cited by NACFE shows that aggressive driving lowers fuel economy by 15 to 30 percent at highway speeds and 10 to 40 percent in stop-and-go conditions. Those are not small numbers.
Cruise control is underused and underappreciated. Studies have shown 7 to 14 percent fuel improvement on flat highway routes simply from using cruise control consistently, because it eliminates the unconscious micro-accelerations a driver’s foot makes when holding speed manually. Most modern engines operate most efficiently in the 1,250 to 1,350 RPM range. Progressive shifting to stay in that band, using cruise control on flat terrain, and reading traffic far enough ahead to coast rather than brake are not complicated techniques. They are habits that separate the 7.8 MPG driver from the 6.3 MPG driver on identical equipment.
Idle time compounds the problem in ways that do not show up on fuel receipts in any obvious way. A class 8 diesel burns roughly 0.8 gallons per hour at idle, according to NACFE estimates. An operator idling for temperature control during extreme weather, waiting at shippers, or sitting in traffic without discipline on engine shutoff can easily log three to five hours of idle per day. At 0.8 gallons per hour, that’s $4.48 per idle hour at current prices, adding up to $13.44 to $22.40 per day in fuel that moved no freight. NACFE estimates that chronic idling can cost a single truck $4,000 to $6,000 annually in wasted fuel.
Aerodynamics: The Equipment Gap You May Not Have Closed
Not all of the fuel economy gap between two trucks on the same lane comes from behavior. Some of it is bolted on, or conspicuously absent. At highway speeds, a semi-truck uses approximately 65 percent of its fuel simply overcoming aerodynamic drag. That means the shape of the truck and trailer is not a cosmetic issue. It is a fuel budget issue.
EPA-verified testing has shown that trailer side skirts alone deliver fuel savings of 7.4 percent. Roof fairings, depending on application and configuration, can improve efficiency by 5 to 15 percent in combination with other aero components. Trailer tails, those collapsible panels at the rear of the box, reduce the low-pressure vacuum drag at the back of a moving trailer and add another 3 to 5 percent. According to NACFE’s research cited by fuel efficiency analyst Mike Roeth, chassis fairings can offer 2 to 4 percent improvements in fuel economy, with trailer skirts adding 1 to 5 percent on top.
Here is the practical implication. An operator running a late-model aerodynamic tractor with a properly spec’d roof fairing, pulling a trailer with side skirts and a tail device, is starting every trip with a substantial structural advantage over the operator running a flat-nosed tractor or a bare box trailer. That advantage does not require a different skill set. It was decided at the spec sheet or the used truck lot.
For owner-operators who cannot afford to rebuild their spec overnight, the highest-ROI starting points are trailer side skirts if you pull your own trailer, a roof fairing if your tractor-to-trailer gap is not already managed, and attention to cab gap sealing. These are not cheap, but at current fuel prices they typically pay back within 12 to 24 months.
Tires: The Floor You’re Ignoring
Tire pressure is the most neglected fuel cost in trucking, partly because the loss is invisible and gradual. NACFE’s research on tire pressure inflation found that a truck running with all tires underinflated by just 10 psi increases fuel consumption by 0.5 to 1.0 percent. At 20 psi of underinflation, field testing puts the fuel penalty at 8 to 10 percent. According to FMCSA data, 55 percent of commercial vehicles have at least one tire running 10 or more psi below optimal. One in five tractors has a tire down by 20 psi or more.
The U.S. Department of Energy data shows under-inflated tires lower fuel economy by approximately 0.2 percent for every one psi drop across all tires. Run the math on a truck with 18 tires down an average of 15 psi, and you are looking at a meaningful, consistent fuel penalty that compounds over every mile.
Tire selection also matters. Low rolling resistance tires cost more upfront and return that premium in fuel. The NACFE fleet study found that fleets moving from standard tires to low rolling resistance tires as part of a broader efficiency program contributed meaningfully to MPG gains across the 20-year dataset they analyzed. For a single-truck operator, the difference in tire cost may seem like the more immediate pain. The fuel difference over 100,000 miles often reverses that calculation.
Maintenance: Where Small Neglect Becomes Expensive
The last piece of the gap is maintenance discipline. A dirty air filter, a poorly adjusted fuel injector, a dragging brake, or a worn engine that has not been properly tuned are each small contributors to fuel economy loss, but they rarely travel alone. An operator who is behind on preventive maintenance is typically dealing with multiple small inefficiencies simultaneously.
ATRI’s 2025 operational cost report showed repair and maintenance costs dropped for the first time since 2020, running just under 20 cents per mile in 2024. For a truck covering 120,000 miles, that is $24,000 per year in maintenance spend. What does not show up in maintenance cost is the fuel penalty from deferred work. A truck with misaligned axles drags. A truck with worn injectors burns more fuel to produce the same power. These losses are quiet and persistent.
Gregg Mangione, executive vice president of maintenance for Penske Truck Leasing, has made the point plainly: if alignment is not correct and the tractor is not tracking with the trailer, the effect is not just on tires. It is on fuel economy. Alignment is a simple, inexpensive check that most operators defer longer than they should.
For Fleet Owners: Closing the Gap Across Multiple Trucks
The MPG gap between your best and worst drivers on the same route can exceed 30 percent on identical equipment. For a fleet running 10 trucks at 120,000 miles each with a 30 percent behavioral difference in fuel efficiency, the cost of not addressing the gap is measured in six figures annually. The approach that actually moves the needle is driver-specific data combined with structured coaching. Artur Express began a driver incentive and coaching program in 2019 when their fleet-wide fuel average was 6.9 MPG. Three years later, the fleet average had risen to 7.7 MPG, generating approximately $2 million in annual fuel savings, according to ATRI’s sustainable driving practices research.
The tools required are telematics data by driver, a consistent coaching process tied to specific behaviors (speed, idle time, acceleration, cruise control use), and a compensation structure that rewards fuel performance. Bonus structures tied to MPG targets have been shown to increase driver engagement and sustain the behavioral improvements. Without the accountability loop, coaching tends to fade within weeks.
Source: FreightWaves
Compiled from international media by the SCI.AI editorial team.